
Millennial travel statistics 2026: 26 numbers on spending, trips & planning
Millennials may have earned the label of the travel generation. But when it comes to what US households actually spent on trips, the federal record’s number is specific.
Millennial households spent $2,574 on trips in 2024; boomer households spent $2,954. And millennial households average 1.2 children under 18 each, boomer households 0.1.
The 26 numbered figures below come with their sources, their bases and their dates.
How to read the age bands on this page.
Most federal sources here publish age bands rather than generations. The exception is the Bureau of Labor Statistics' Consumer Expenditure Survey, whose Table 2602 publishes five generation columns by birth year. Those columns are the brackets this page reads by.
Gen Z — born 1997–2012, ages 13–28
Millennials — born 1981–1996, ages 29–44
Gen X — born 1965–1980, ages 45–60
Boomers — born 1946–1964, ages 61–79
Older — born 1945 or earlier, ages 80+
Millennial travel statistics: key stats at a glance
Millennial households spent $2,574 on trips in 2024; boomer households spent $2,954.
Millennials were 27.1% of Americans aged 18 and over in 2025.
Millennial-headed households supplied an estimated $95 billion of US households’ $364 billion 2024 trip spending.
27.4% of US overseas air travelers were aged 30–44 in 2025, up from 26.1% in 2019.
Women were 54% of US overseas air travelers aged 30–44 in 2025, 56.7% overall.
16.5% of US overseas package-tour travelers were aged 30–44 in 2025; 39.8% were 65 or older.
Travel-agency use for trip information fell from 14.1% to 8.0% of US overseas air travelers, 2019–2025.
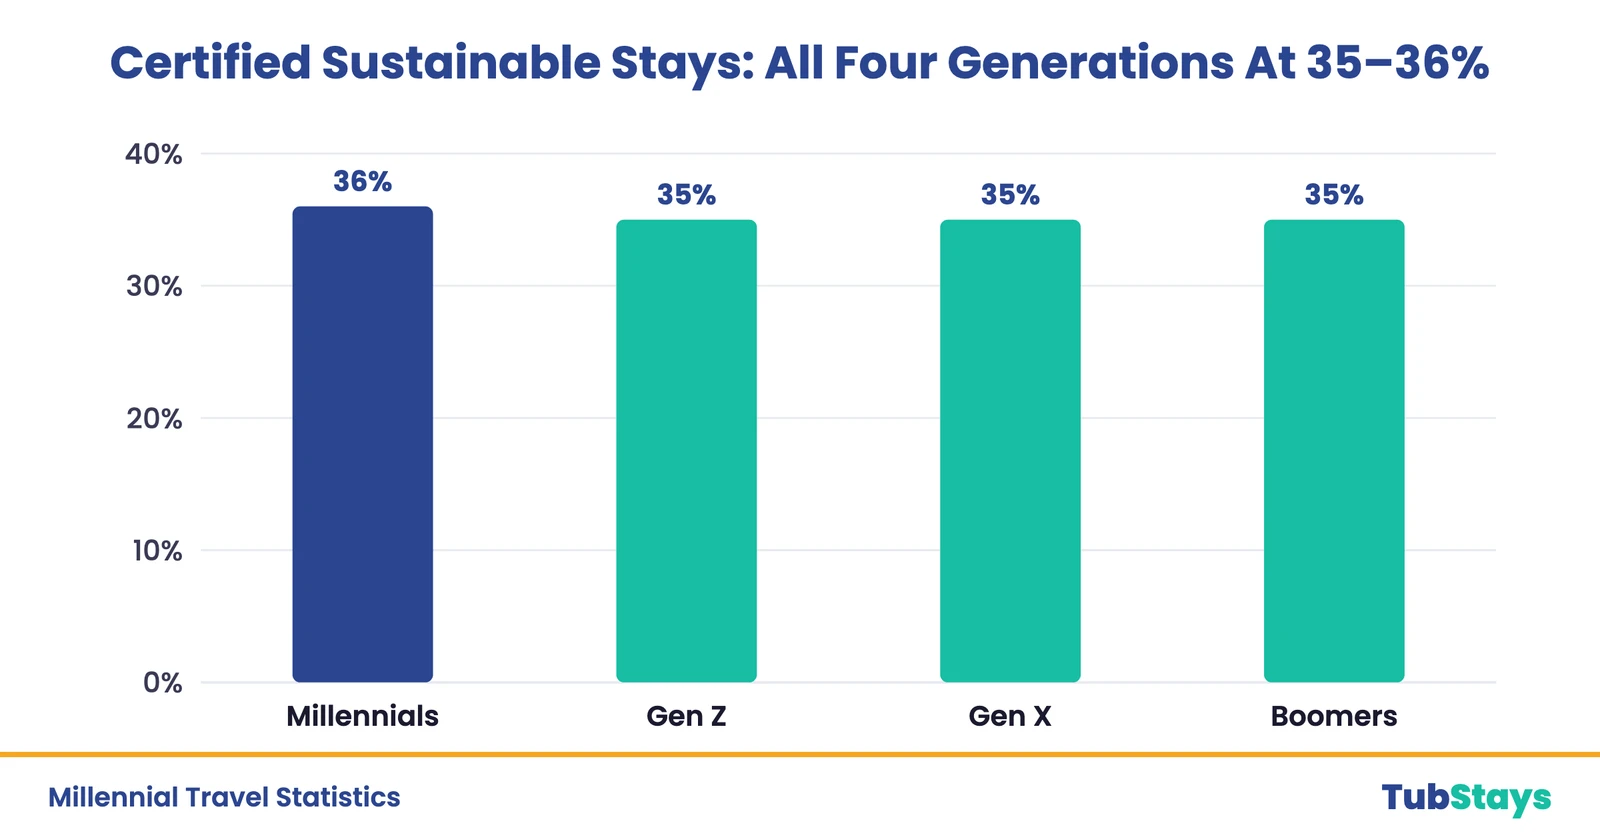
All four generations plan a certified sustainable stay at 35–36% in 2026—millennials 36%.
Do millennials travel the most?
No. Americans aged 45 to 54, inside Gen X’s bracket, take the most air trips, 5.2 in 2025 against 4.9 at ages 35–44, the older half of millennials. Millennials are 29.7% of American travelers, behind a merged boomers-and-older bucket at 33.7%.
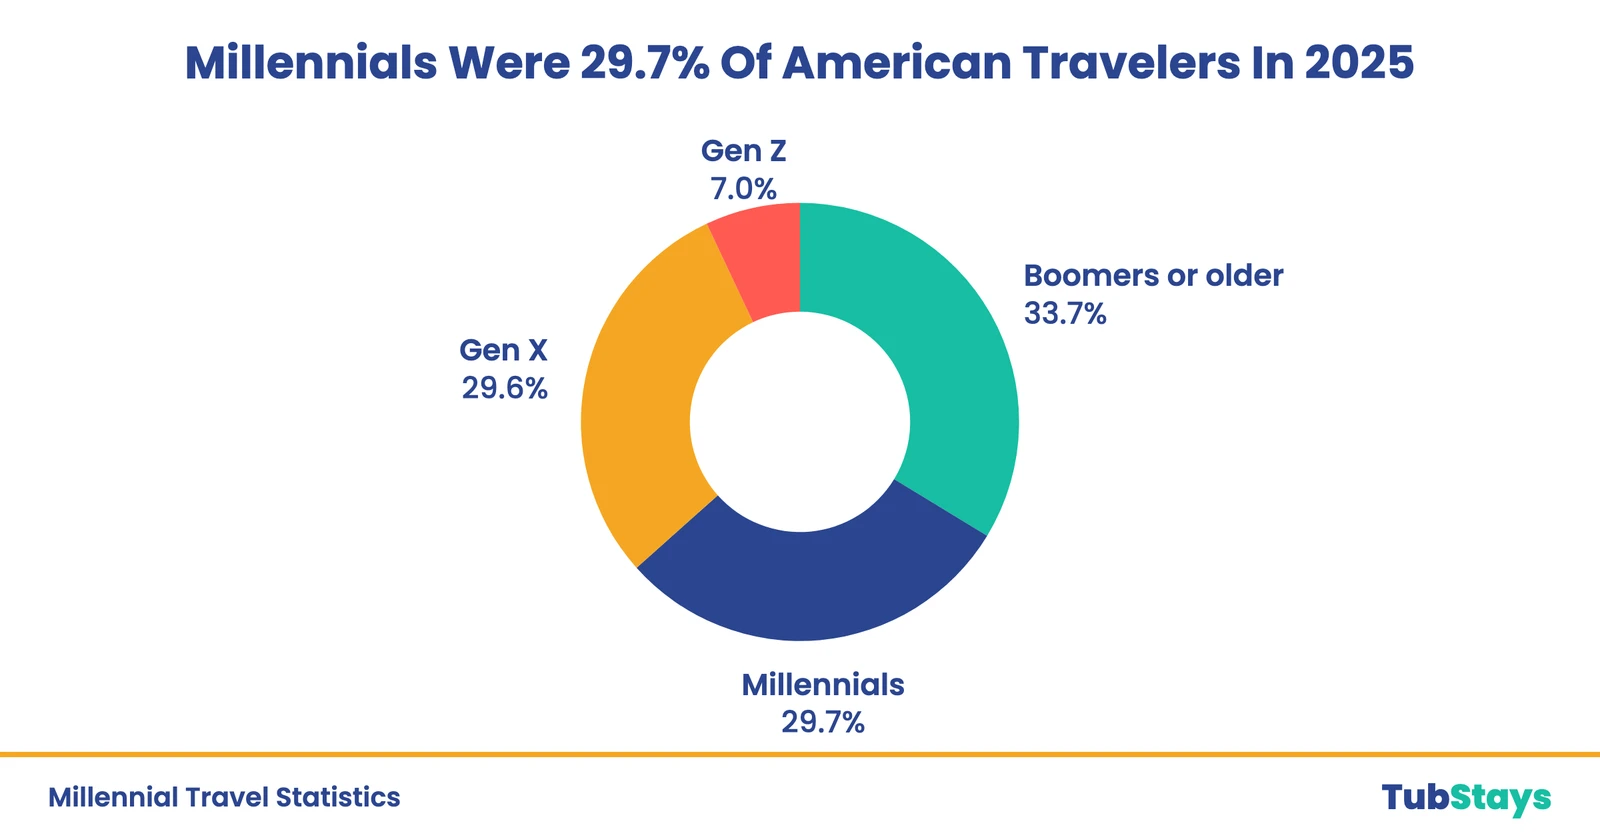
1. 29.7% of American travelers were millennials in 2025; 33.7% were boomers or older.
Gen X accounts for 29.6% and Gen Z for 7.0%, and the average American traveler was 49.6 years old, on Future Partners’ 2025 base. The publisher’s deck gives no age band or birth years. So millennials are the second-largest group of American travelers, behind a merged boomers-and-older bucket.
Source: Future Partners 2026
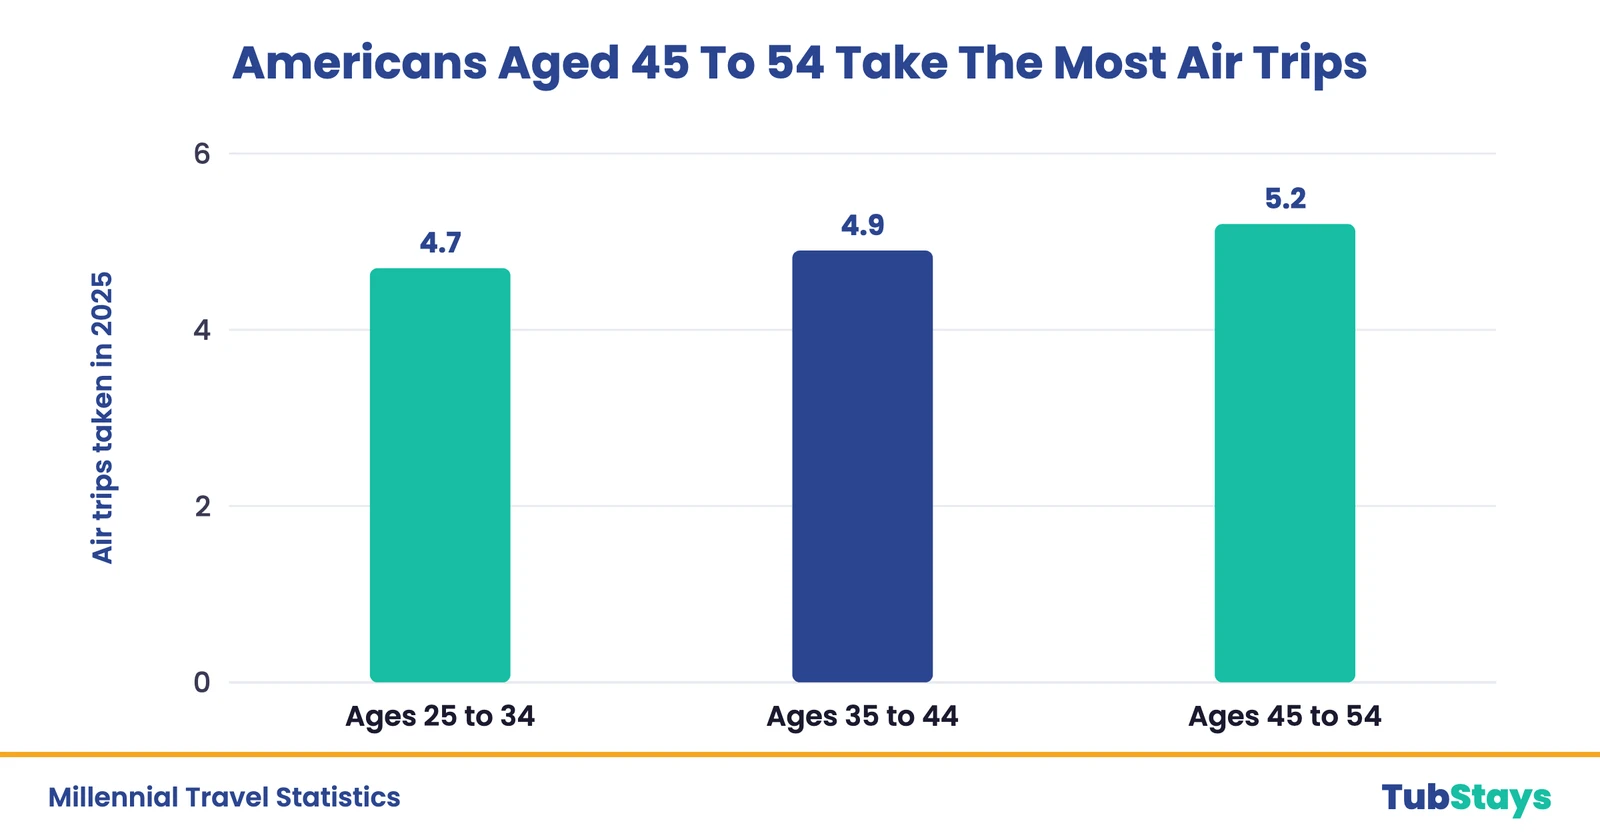
2. 4.9 air trips were taken in 2025 by Americans aged 35–44; 5.2 by those aged 45–54.
Americans aged 25 to 34 took 4.7, on a survey Ipsos fielded for Airlines for America, an airline trade association (n=3,380 qualified). A4A’s tables publish age bands rather than generation labels. So 25 to 34 spans the oldest of Gen Z and younger millennials, 35 to 44 is the older half of millennials and 45 to 54 sits inside Gen X’s bracket. The counts are air trips only, business and personal combined.
Source: Ipsos for A4A
3. 29.7% to 31% of American travelers are millennials; 27.1% of US adults are.
Future Partners reads 29.7%, Deloitte 31% on its 2026 summer survey (n=4,003), and neither discloses the birth years it’s using. A traveler share above an adult share is what income and life stage predict. That isn’t a finding. The 21.4% usually offered as a comparator is millennials’ share of the total population, children included, a different base than a traveler share.
Sources: Future Partners, US Census 2025
Which generation spends the most on travel?
Boomer households. They spent $2,954 on trips in 2024 against millennial households’ $2,574. Millennial households average 1.2 children under 18; boomer households, 0.1.
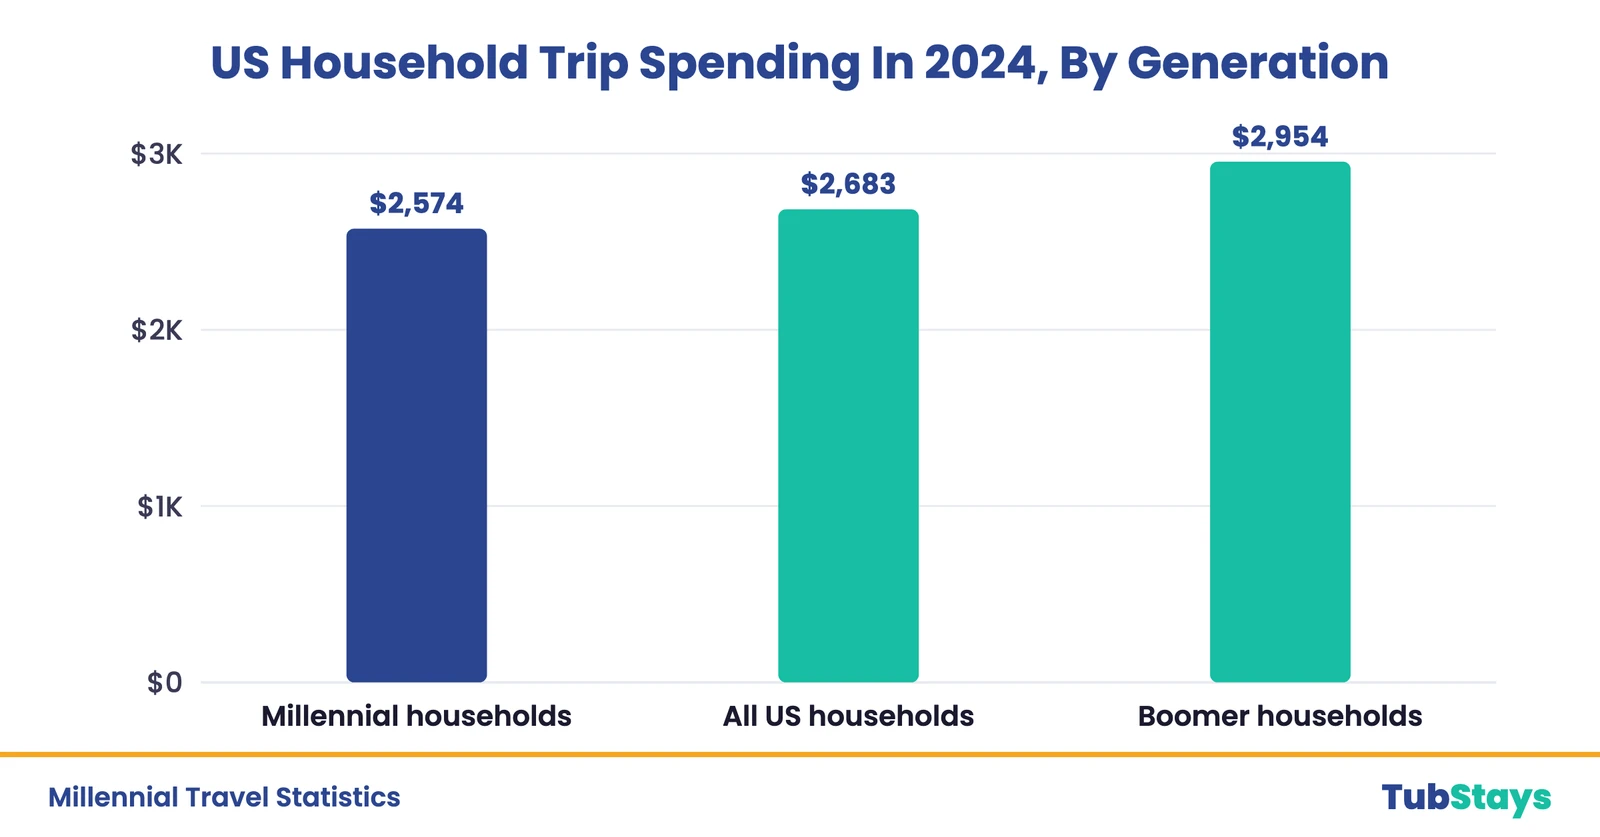
4. Millennial households spent $2,574 on trips in 2024; boomer households spent $2,954.
That’s a gap of 1.15×, on our division of two published integers. Millennial-headed units hold 3.0 people including 1.2 children under 18, boomer-headed units 1.9 including 0.1. Both therefore contain about 1.8 people aged 18 or over, so per adult the figures run about $1,430 and $1,641—the same 1.15× as per household. Per member, which counts children as spending units, the same data gives $858 and $1,555. Thirteen BLS trip line items build each total, with auto rental and taxi excluded because BLS’s 2023–24 streamlining broke both series. So the whole distance between those two readings is children in the denominator.
Source: BLS CE Table 2602
5. Millennial-headed households supplied an estimated $95 billion of US households’ $364 billion 2024 trip spending.
The average millennial-headed consumer unit spent $2,574 against a $2,683 all-household average, and 36,777,000 units carry that mean. That’s why the $95 billion is an estimate: a survey mean times a survey-based household count. It’s a household total, covering everyone who lives in those households.
Source: BLS CE Table 2602
6. Millennial households spent $1,109 on entertainment fees and admissions in 2024; all households, $935.
That’s 1.19× the national average per household, and per adult it’s the same 1.19×, because both household types hold about 1.8 adults. Per member, counting children, the figures are $370 against $390, which reads 5% below and holds at published precision. Boomer-headed households spent $391 per member. And the only thing separating the two readings is whether children count as spending units.
Source: BLS CE Table 2602
7. Millennial-headed households spent 26% less than average on lodging away from home in 2024.
Lodging away from home runs 0.74× the national average per household and per adult, and 0.59× per member, below on every basis. Public and other transportation is below on both, but only just per household at 0.96×. On entertainment, on fees and admissions and on food away from home the direction reverses: above average per household, below average per member. Millennial-headed households are 27.1% of US consumer units and hold about 34% of the people, 33% to 35% at published precision. In fact, they also run above the per-member average on rented dwellings and mortgage interest, so this is a travel finding, not a spending-wide one.
Source: BLS CE Table 2602
8. US millennial households averaged 1.2 children under 18 in 2024; boomer households, 0.1.
Across all US consumer units the average is 0.6, read directly from Table 2602 row 17, double at BLS’s one decimal. Both the 1.2 and the 0.1 print to one decimal, so there’s no stable ratio between them and none is given here. These numbers reaffirm the mechanism behind the per-member figures above.
Source: BLS CE Table 2602
Millennials abroad: US overseas air travel statistics, ages 30 to 44
9. 27.4% of US overseas air travelers were aged 30–44 in 2025, up from 26.1% in 2019.
Both readings are our addition of SIAT’s three five-year bands from 30 to 44, summed across its separately published male and female cells. This tracks an age band over time, not a cohort over time. Ages 30 to 44 in 2019 were born 1975 to 1989, nine of those fifteen birth years millennial and six Gen X, so the 2019 reading was already majority millennial. And the 2025 reading is the millennial one.
Sources: NTTO SIAT 2025, 2019
10. Millennial-cohort US overseas air trips grew 24.9% from 2019 to 2025; the market grew 25.3%.
So the two growth rates are approximately flat. The band shifts five years of age across six years of time, ages 25 to 39 in 2019 against 30 to 44 in 2025. That’s the closest SIAT’s five-year bands come to holding the cohort constant. And five-year bands don’t align to a sixteen-year cohort. SIAT counts trips, not people: weighted to Homeland Security departure records, one person taking three trips counts three times.
Sources: NTTO SIAT 2025, 2019
11. 30-to-44-year-olds took 15 million US overseas air trips in 2025, up from 12 million in 2019.
These absolutes are the fixed 30-to-44 band and grew about 32% between 2019 and 2025. The 24.9% above is a different cohort-shifted band, and rounding to two significant figures makes the two look alike. Both are our multiplication of the band’s SIAT share by the weighted departure total, and both count trips, not people. This tracks an age band over time, not a cohort over time.
Sources: NTTO SIAT 2025, 2019
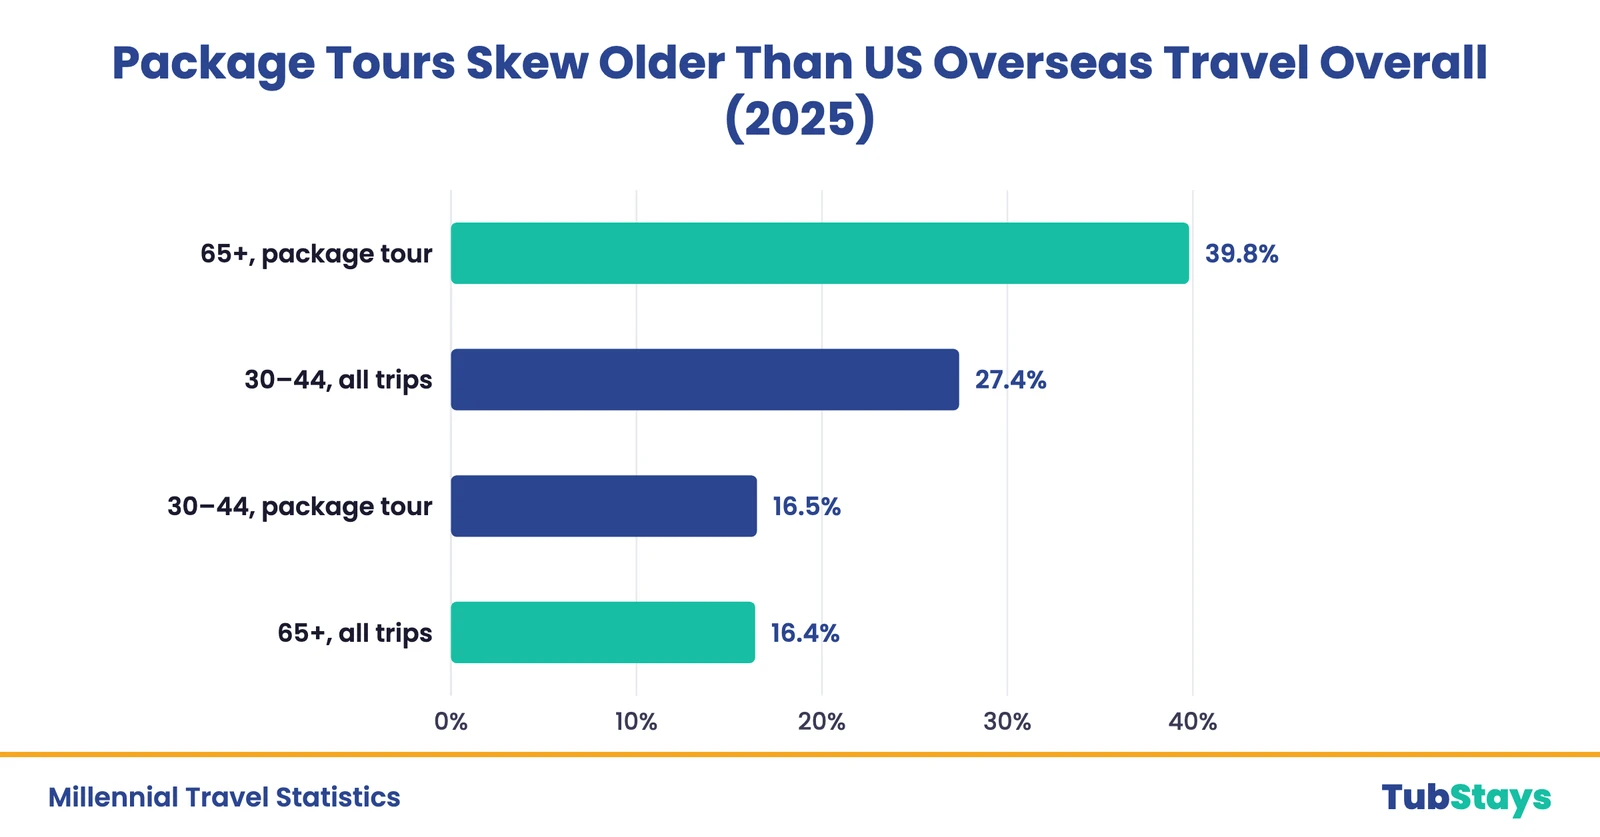
12. 16.5% of US overseas package-tour travelers were aged 30–44 in 2025; 39.8% were 65 or older.
The baseline shares are 27.4% and 16.4% of all US overseas air travelers. So ages 30 to 44 ran 0.60 times their share, and travelers 65 and over ran 2.4 times theirs. That top band crosses into the generations older than boomers and leaves out boomers aged 61 to 64. The 16.5% and the 39.8% come from Table 36’s one denominator, the indices are ours and package-tour travelers are a subset.
Source: NTTO SIAT Table 36
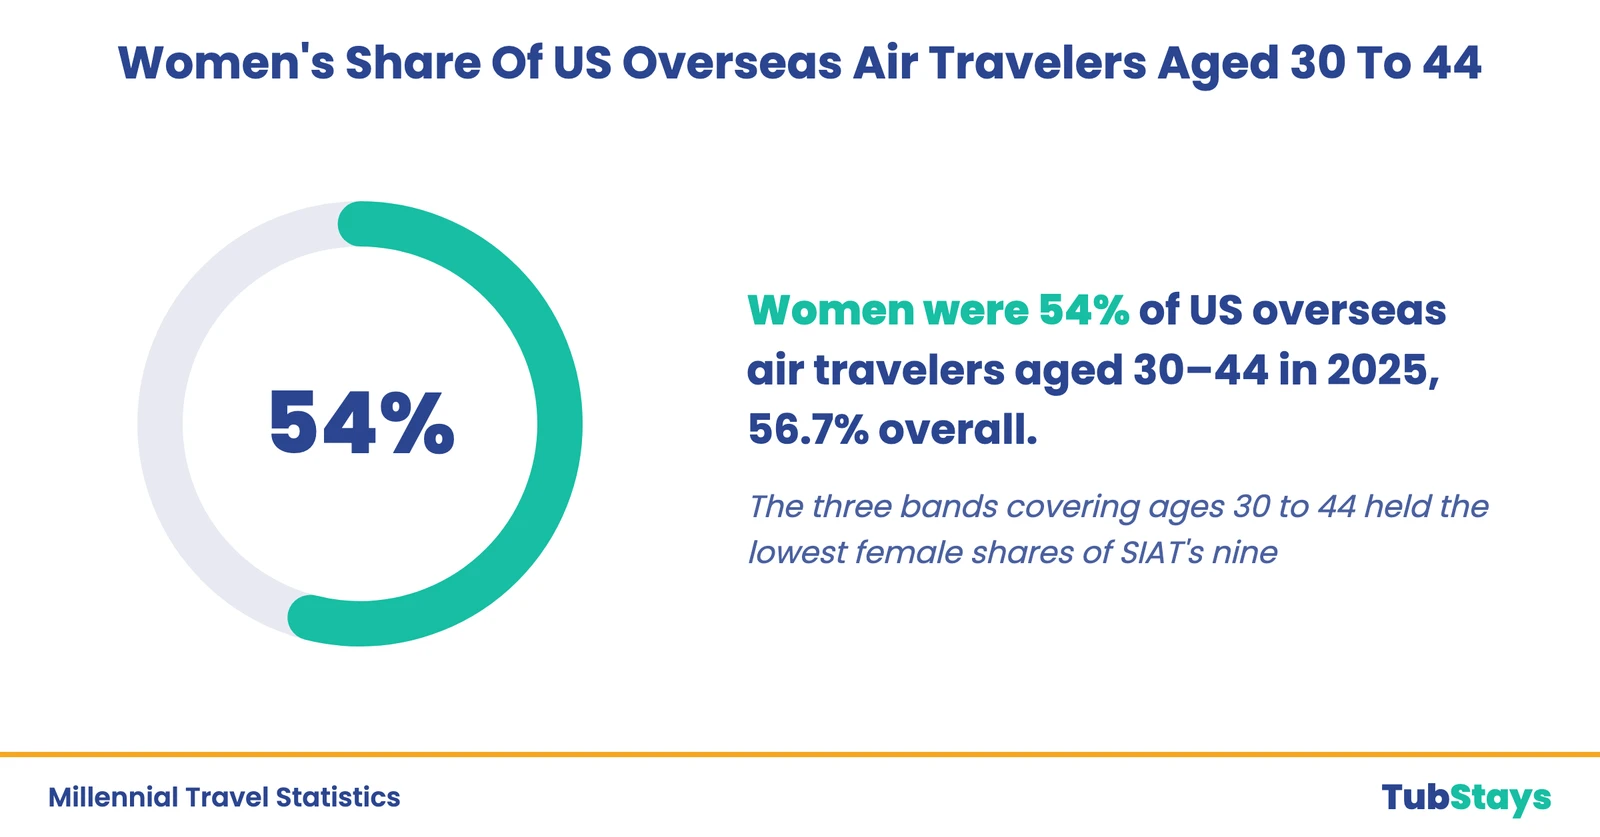
13. Women were 54% of US overseas air travelers aged 30–44 in 2025, 56.7% overall.
SIAT’s tables publish male and female cells separately and never the split inside an age band, so the division is ours. The three bands covering ages 30 to 44 held the lowest female shares of SIAT’s nine. But cells print to one decimal, so the ordering holds only by a narrow margin.
Source: NTTO SIAT 2025
Time, leave and the cost of a trip
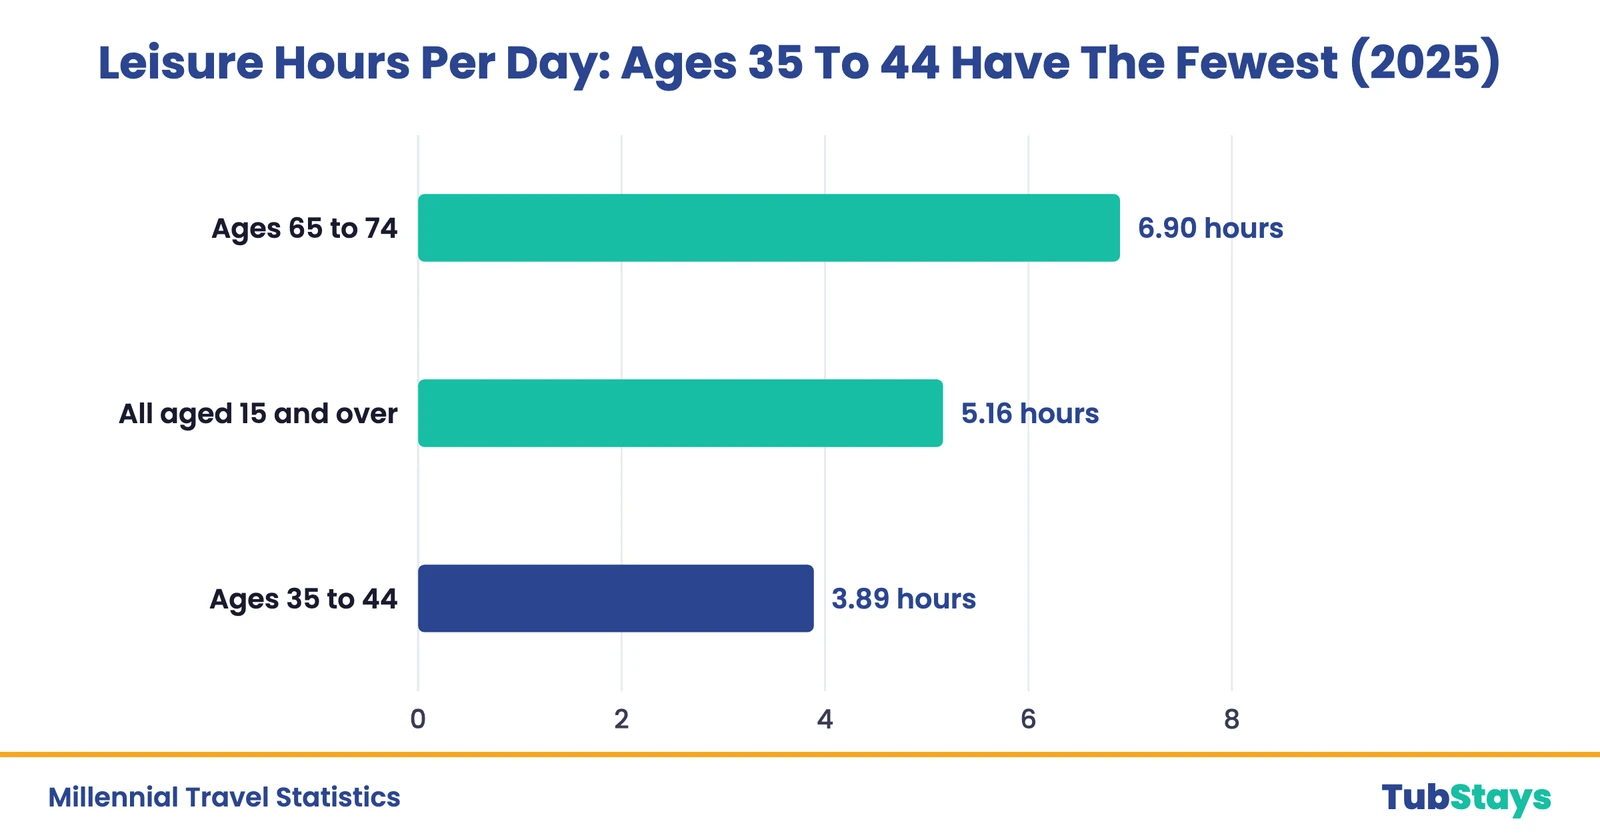
14. Americans aged 35–44 get about 460 fewer leisure hours a year than the average American.
The band averaged 3.89 leisure hours a day in 2025 against 5.16 for Americans aged 15 and over, the comparator in the heading. That’s the lowest of any adult group, against 6.90 at ages 65 to 74, inside the boomer bracket. And the band isn’t just lowest on leisure—it posted the highest daily work time, 4.83 hours, and the highest caregiving, 1.23. ATUS averages across all days of the year, so our annual figure is arithmetic the measure supports, not anyone’s calendar. Ages 35 to 44 in 2025 is born 1981 to 1990, the older half of the cohort.
Source: BLS ATUS 2025
15. 69% of US private-industry workers get under 15 paid vacation days after a year (2025).
Another reading of the same distribution puts 38% under 10 days, on our sum of the National Compensation Survey’s March 2025 bands. BLS publishes no age breakdown on paid-leave access at all, so it’s a US private-industry figure, never a millennial statistic in any form.
Source: BLS NCS, March 2025
16. 36% of US millennials say once-attainable trips now feel like a luxury (2026).
That comes from a Priceline-commissioned Wakefield Research survey of 2,500 US adults fielded in March 2026. Priceline’s release calls it the highest of any generation on its survey, and no comparison cells are published. The instrument gives no millennial birth years, so the label is the panel’s own.
Source: Priceline/Wakefield 2026
17. Millennials repaid 43.9% of borrowed 2024 trip costs within three months; boomers repaid 65.8%.
Millennials and boomers financed almost the same share of their last trip’s cost, 17.3% and 17.2%, and reported repaying 1.50× apart. The national three-month reported-repayment mean is 52.7%, on Future Partners’ August 2024 wave (n=4,004). The publisher’s deck gives no age band or birth years. Surprisingly, the borrowing is near-identical and the repayment isn’t.
Source: Future Partners, Aug 2024
Planning, booking and where people stay
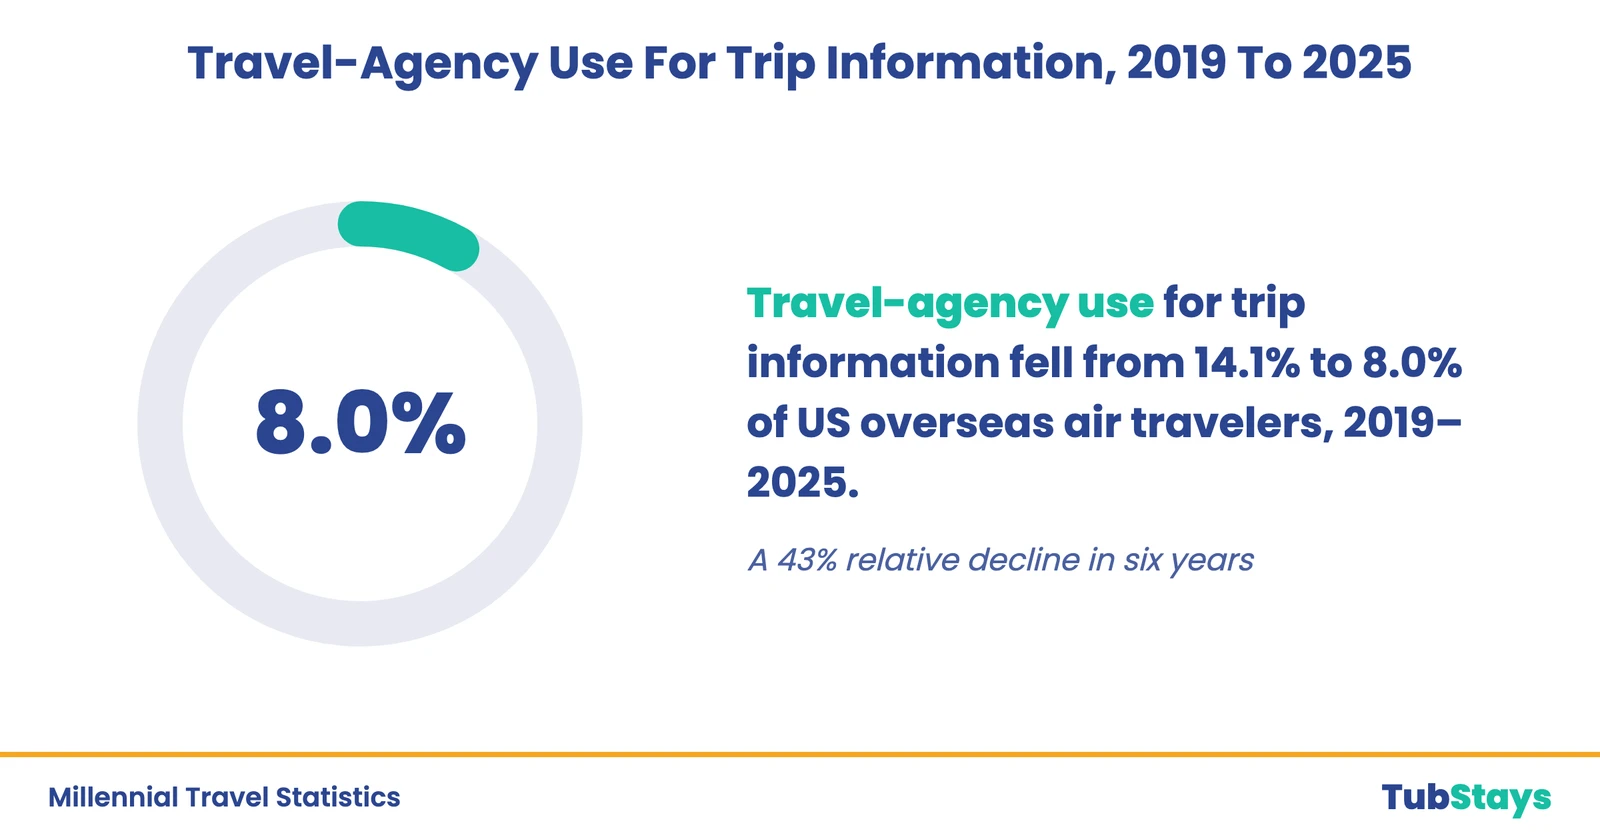
18. Travel-agency use for trip information fell from 14.1% to 8.0% of US overseas air travelers, 2019–2025.
That’s our figure: a 43% relative decline. Q6a asks where trip information came from and allows multiple responses, so shares don’t sum to 100. It’s an information-source question and never merges with SIAT’s Q9 booking series that follows.
Sources: NTTO SIAT 2025, 2019
19. 60.7% of US overseas air travelers booked direct with airlines in 2025, 43% in 2019.
Q9 is a multiple-response question, so shares don’t sum to 100. The 2025 figure is Table 5 of SIAT’s annual file (n=49,554). But the 2019 comparator comes from NTTO’s own management analysis of 2022 outbound travel, a second artifact and not a SIAT file. Booking channel and information source are different questions.
Sources: NTTO SIAT 2025, NTTO 2022
20. Millennials were 2.0× over-represented among American AI trip planners in 2024, 60.6% of them.
Millennials were 30.0% of all American travelers in that wave. That’s composition, not a rate: it says what share of AI trip planners are millennials, not what share of millennials used AI. AI tools were used by 11.3% of travelers in the wave (n=4,004), so the cell rests on roughly 450 respondents, and the publisher’s deck gives no age band.
Source: Future Partners, Aug 2024
21. Alternative accommodations were 36% of Booking.com’s booked nights in 2025, from about 89% of listings.
Booking Holdings’ 2025 Form 10-K puts roughly 3.9 million alternative-accommodation properties against roughly 500,000 others. Two of the filing’s inputs are approximations, which is why the listings share reads about 89%, and the 36% is approximate in the filing too. Booking Holdings carries no age split, so it’s never assigned to a generation. This is Booking Holdings’ filing, not the Booking.com research below.
Source: Booking Holdings 10-K
22. All four generations plan a certified sustainable stay at 35–36% in 2026—millennials 36%.
Gen Z, Gen X and boomers all sit at 35%, on the Travel & Sustainability Report 2026 from Booking.com’s research arm (n=32,500, millennials at ages 29 to 44). Booking.com sells a sustainable-stay certification, so it’s vendor research with a direct commercial interest. The sample covers 35 countries and territories, not the US alone. So on this one question the four generations sit within a point of each other.
Source: Booking.com, Jan 2026
23. 71% of millennials want to travel more sustainably; 41% plan to travel off-peak (2026).
Among boomers the relationship inverts, 47% wanting to travel more sustainably against 63% who plan to travel off-peak. These are two different questions on the vendor’s January 2026 panel, and both are stated intent rather than measured behavior. Booking.com sells a sustainable-stay certification, so it’s vendor research with a direct commercial interest. The sample covers 35 countries and territories, not the US alone.
Source: Booking.com, Jan 2026
24. Trip.com says millennials will contribute almost half its global 2026 booking volume.
Trip.com defines millennials as ages 29 to 44 and calls them its “largest group of travellers in 2026”. The figure is Trip.com’s own global platform data, not a US measurement. It rests on early bookings, not a closed count: bookings held on 14 December 2025 for travel in the first quarter of 2026, generalized to the year. Trip.com’s release publishes no sample size and no method.
Source: Trip.com, Dec 2025
What “millennial” means, and what the surveys never measured
25. Hostelworld’s 18–34 band covered 14 millennial birth years in 2017, 6 in 2025.
In 2017 the band held people born 1983 to 1999, and in 2025 people born 1991 to 2007. Hostelworld’s annual reports for 2017, 2018 and 2025 all put its target travelers at 18 to 34, and the wording changed while the band didn’t. The same reports use 18 to 35 in the traveler panel, on which the count differs. That’s a count of birth years inside a fixed band, not of customers.
Source: Hostelworld AR2025
26. 59.2% of US overseas air travelers travelled alone in 2025, 60.3% in 2019.
The share traveling with family or relatives rose from 14.7% to 16.4%, and Q14 allows multiple responses. The 60.3% is the outbound monitor’s figure, because SIAT’s annual file begins in 2022 and has no 2019 column. This is the only current, large-sample, behavioral US travel-party measurement in this source set. It carries no generational cut and is never a millennial figure.
Sources: NTTO SIAT 2025, 2019
Millennial Travel Statistics: Frequently Asked Questions
Do millennials travel the most?
No. Americans aged 45 to 54, inside Gen X’s bracket, take the most air trips, 5.2 in 2025 against 4.9 at ages 35–44, the older half of millennials. Millennials are 29.7% of American travelers; 33.7% were boomers or older, a merged bucket, with Gen X at 29.6% and Gen Z at 7.0%.
Which generation spends the most on travel?
Boomer households. They spent $2,954 on trips in 2024 against millennial households’ $2,574, a gap of 1.15×. Millennial households average 1.2 children under 18; boomer households, 0.1.
Who travels more, Gen Z or Millennials?
Not comparable on this evidence. The two published shares are composition, not rates: millennials 29.7% of American travelers against Gen Z’s 7.0% in 2025, with Gen X 29.6% and boomers or older 33.7%. Future Partners publishes no Gen Z band, and part of that gap is age: Gen Z in 2025 starts at 13, below travel-survey age.
What is the millennial travel trend?
Up on the age band that best proxies millennials abroad. 27.4% of US overseas air travelers were aged 30–44 in 2025, up from 26.1% in 2019—an age band tracked over time, not a cohort. Millennial-cohort US overseas air trips grew 24.9% from 2019 to 2025; the market grew 25.3%.
What are the statistics of millennials?
Millennials were 27.1% of Americans aged 18 and over in 2025. About 73 million Americans were millennials in 2025. Millennial-headed households supplied $95 billion of the $364 billion US households spent on trips in 2024, an estimate and a household total covering everyone in those households.
About Ritesh Kumar
Contributing writer at TubStays Blog